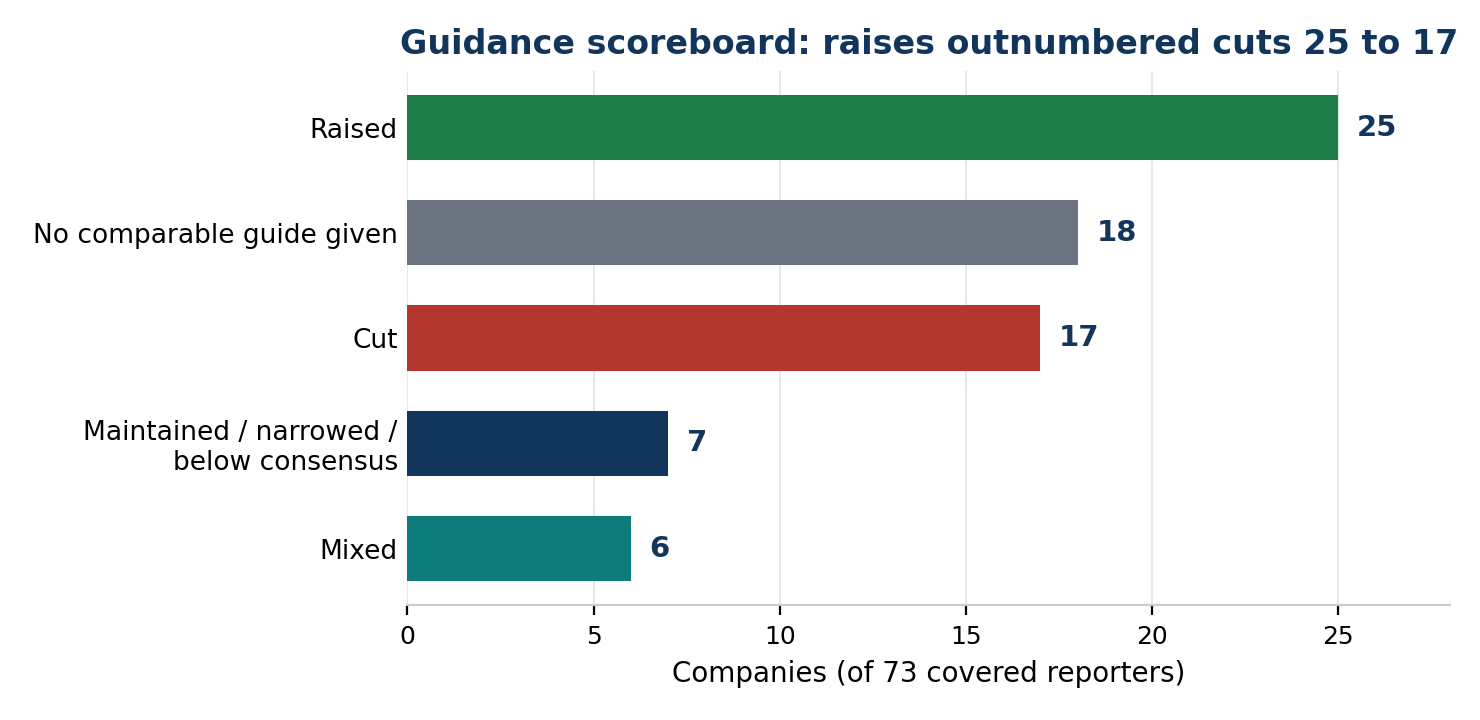
Executive Summary
The October 2026 earnings season, through October 29, delivered a paradox. Operating results were, in aggregate, strong: cloud growth re-accelerated at all three hyperscalers, the memory complex posted record profitability, Eli Lilly raised its revenue outlook on surging GLP-1 demand, and the defense and power-infrastructure complex (GE Vernova, Vertiv, L3Harris, Linde) raised guidance in unison. Yet the market's reaction function was the story of the season. With the S&P 500 near record highs, the 10-year Treasury at roughly 5%, and the Federal Reserve holding rates at 3.75-4.00% on October 28 while signaling a possible December hike, investors paid for certainty about the future - and sold almost everything else.
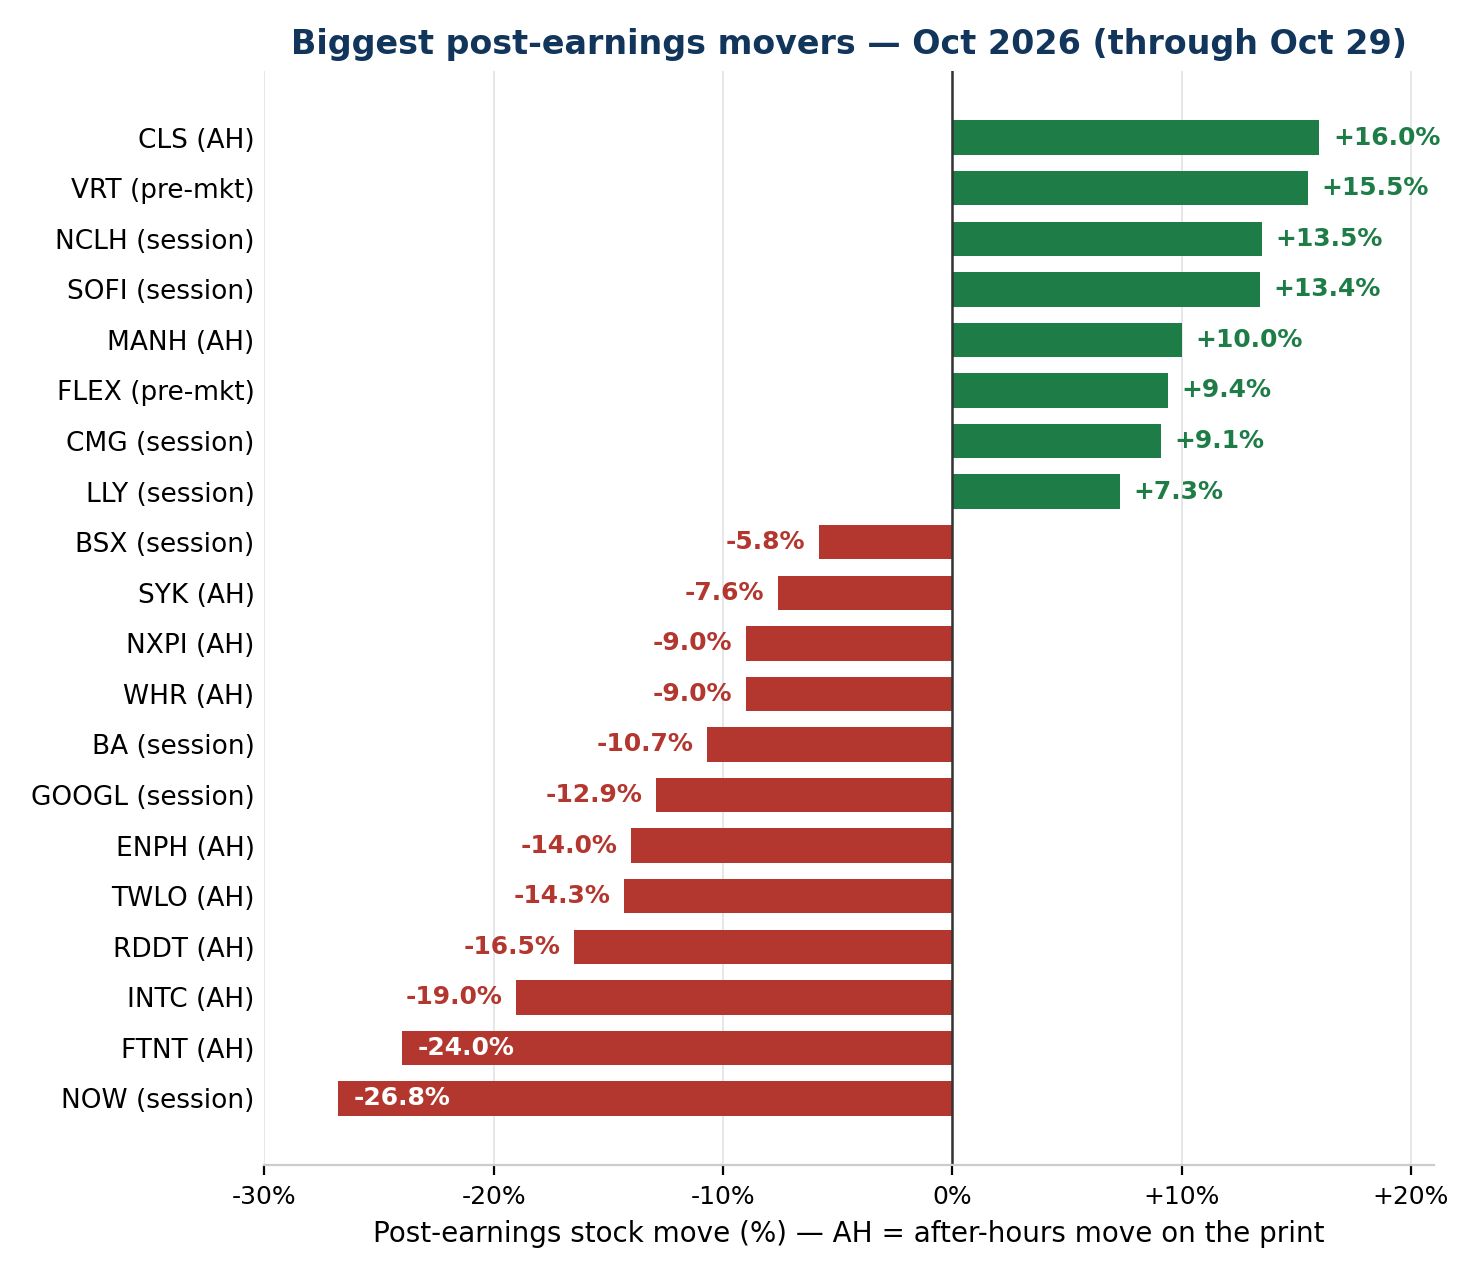
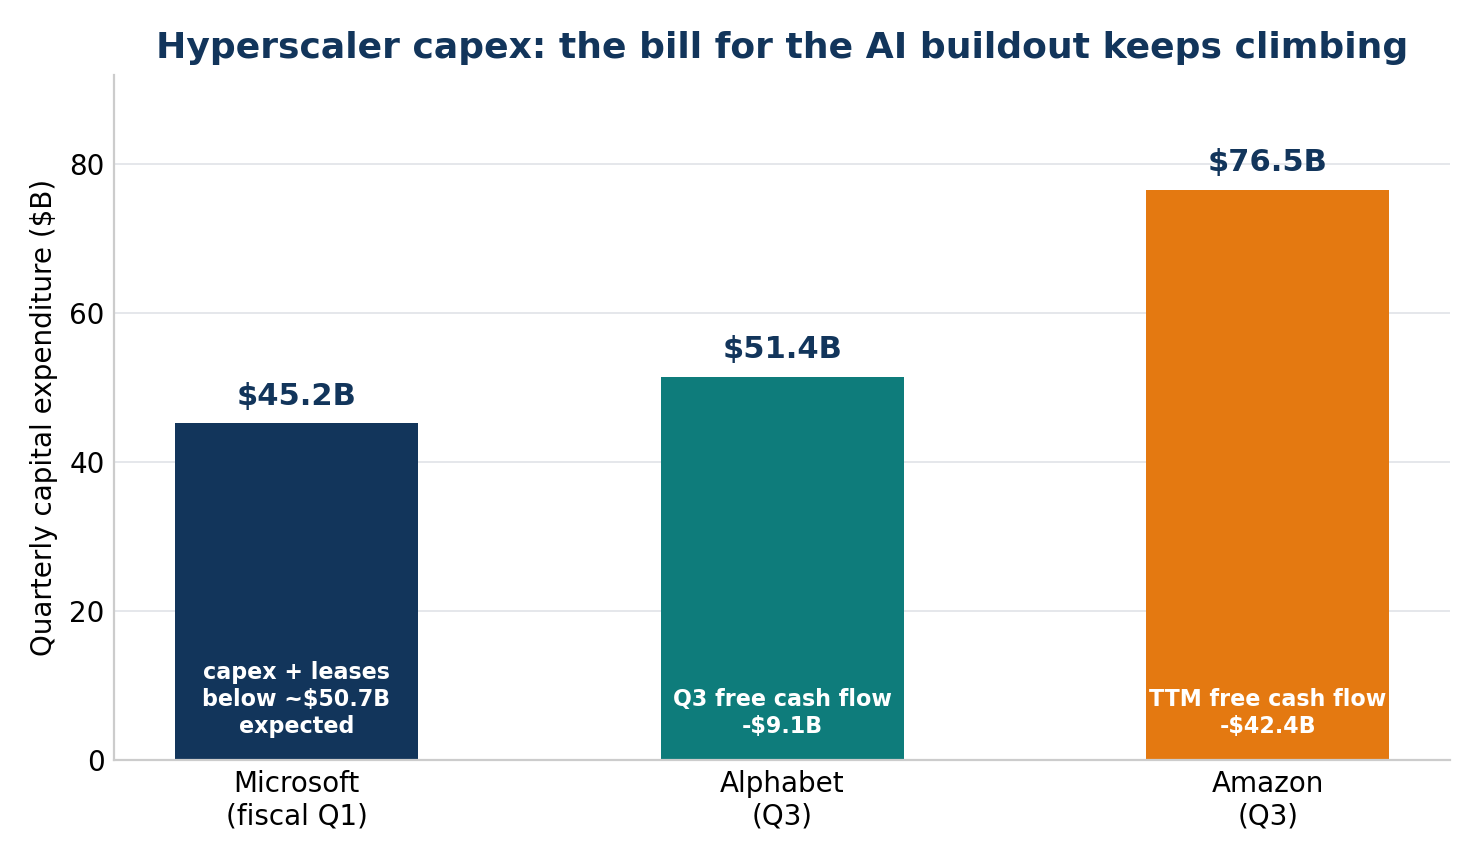
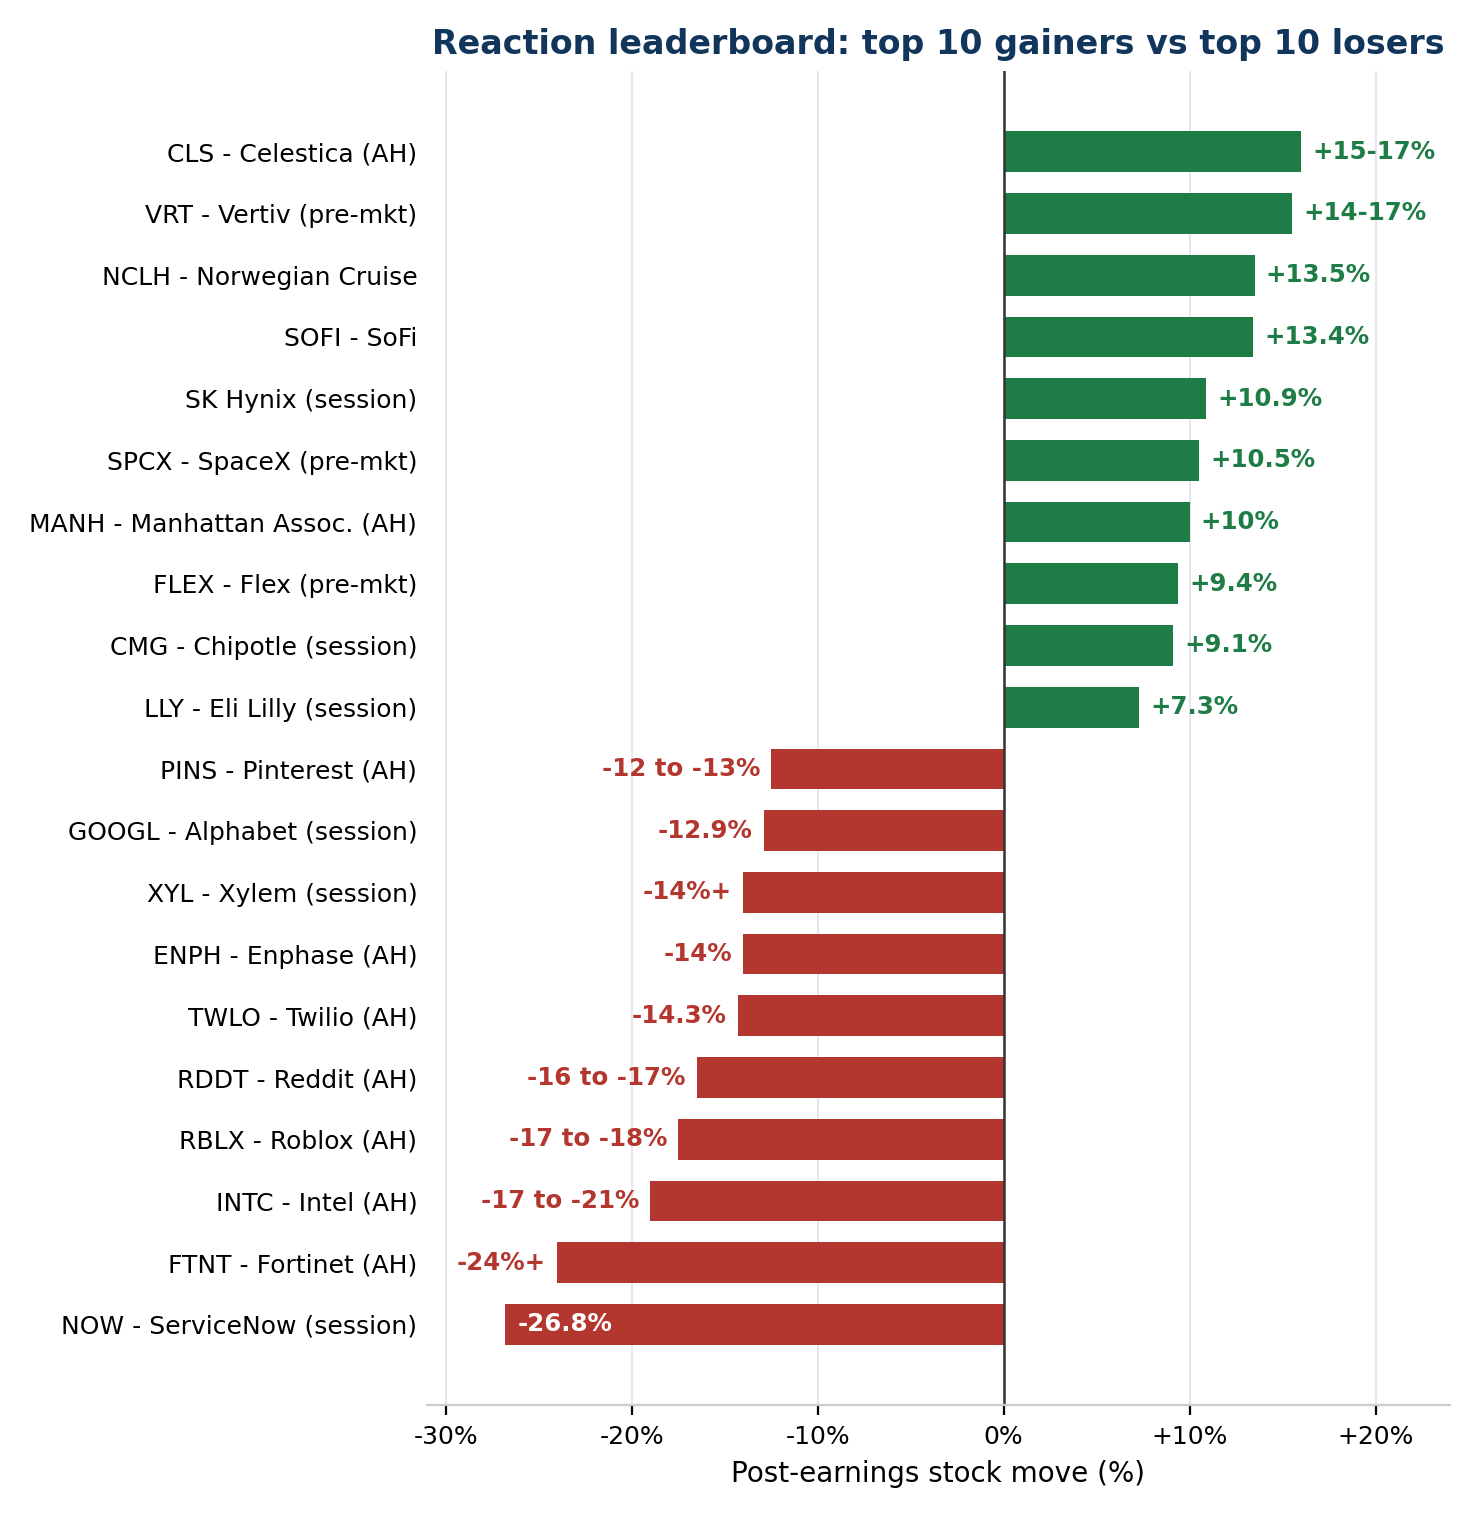
Three patterns define the season so far. First, an AI capital-expenditure reckoning: Alphabet's stock fell 12.9% on October 29 despite revenue of $127.6B (+25%), because $51.4B of quarterly capex drove free cash flow to -$9.1B; Amazon's trailing-twelve-month free cash flow swung to -$42.4B on roughly $76-77B of quarterly capex. Microsoft, whose $45.2B capex-and-leases bill came in below the ~$50.7B expected, was the only hyperscaler rewarded (+5% after hours). Second, guidance trumped prints: ServiceNow lost 26.8% in a single session - its worst day in more than 14 years - on a two-point shortfall in subscription-revenue growth guidance, while Fortinet fell more than 24% after hours on a clean beat-and-raise, and Caterpillar and Lam Research were sold on good quarters with cautious framing. Third, dispersion was extreme and stock-specific: single-day and after-hours moves of +16% (Celestica) to -27% (ServiceNow) made this a stock-picker's season in the middle of an index that barely moved.
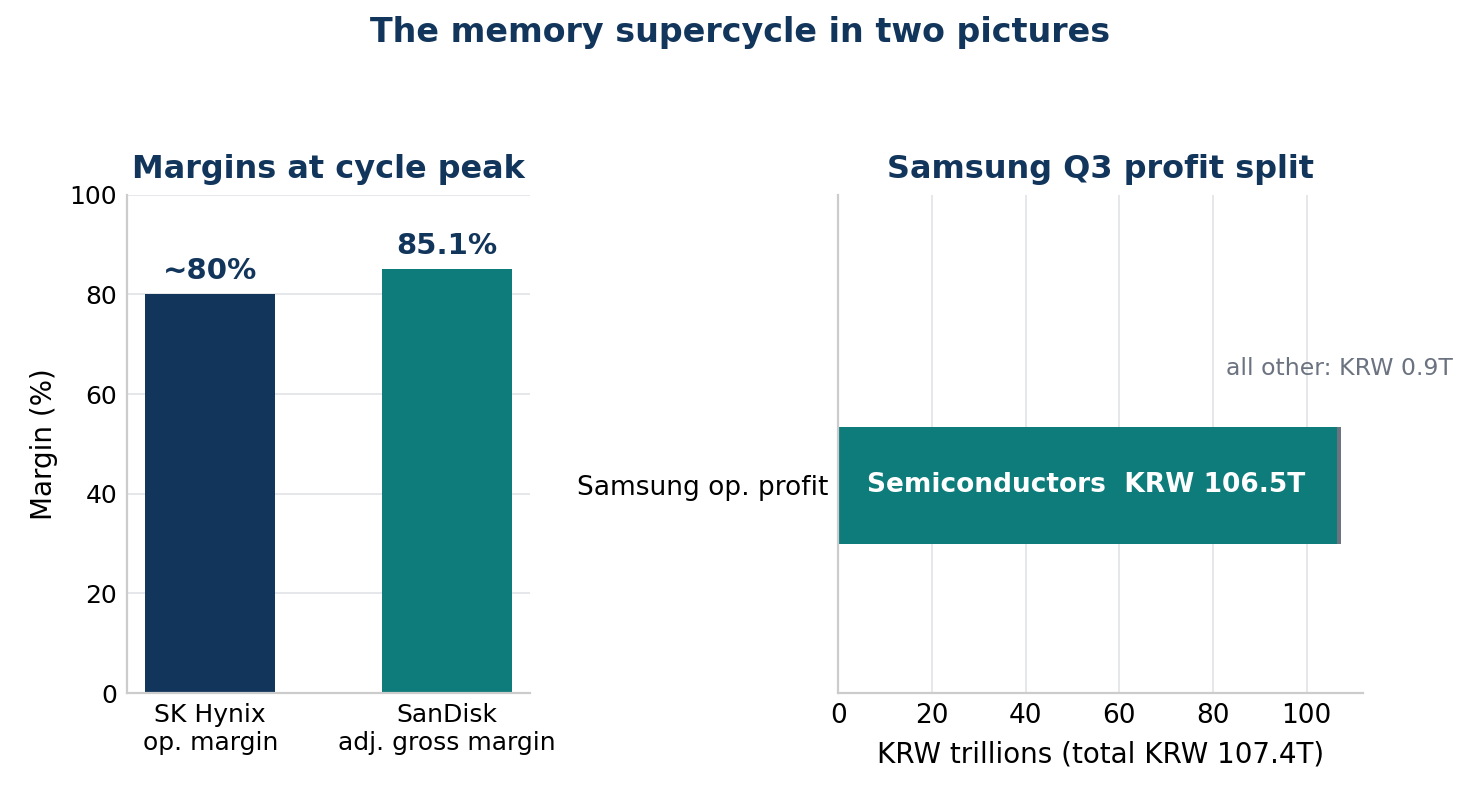
Beneath the index calm, the season also confirmed real-economy breadth. Industrial and infrastructure demand tied to data centers was the economy's standout (Vertiv orders, GE Vernova's $29B order intake and $197B backlog), memory-chip pricing power reached levels rarely seen in any industry (SK Hynix at roughly an 80% operating margin; SanDisk at an 85.1% gross margin), healthcare split sharply between GLP-1 winners and medtech names cutting guidance (Boston Scientific, Stryker), and the consumer held up - Chipotle's comparable sales beat and Starbucks' U.S. comps of +7.7% - though margins, not traffic, are now the battleground. Housing remained the weak spot, with D.R. Horton's miss and soft fiscal 2027 guidance the season's clearest read on rate-sensitive demand.
What follows: the season's five big themes, the market backdrop, the complete results table for every significant reporter (actuals vs. consensus, guidance direction, and post-earnings market reaction), and deep dives on the 24 prints that mattered most.
Biggest single-session loser
ServiceNow -26.8% (Oct 29)
Biggest gainer
Celestica +15-17% after hours
Largest revenue print
Amazon $201.9B in Q3
Highest op. margin
SanDisk gross margin 85.1%
Deepest guide cut
Whirlpool FY EPS to -$1.30
Cloud growth peak
Google Cloud more than doubled
The Season's Five Big Themes
1. The AI capex reckoning: cash flow is the new scoreboard
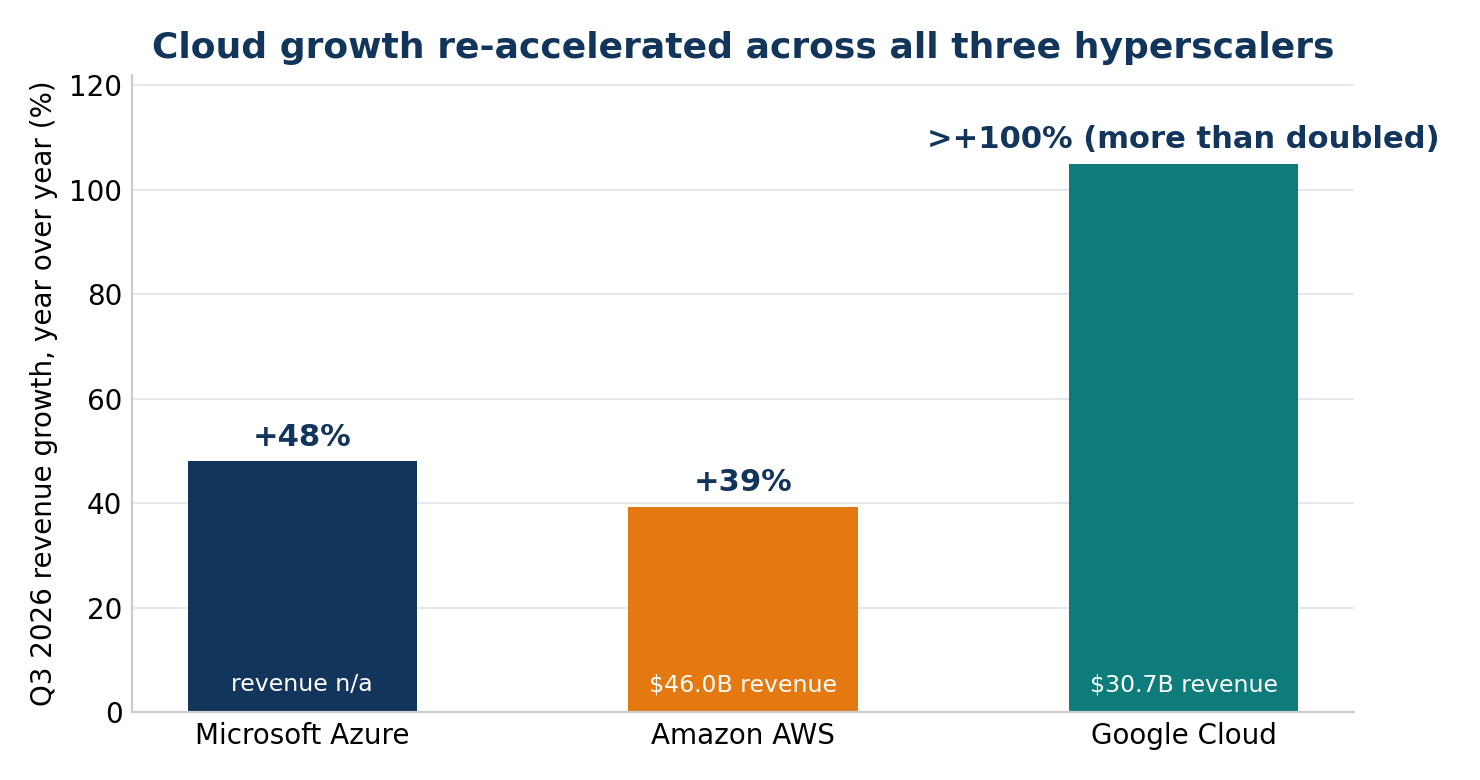
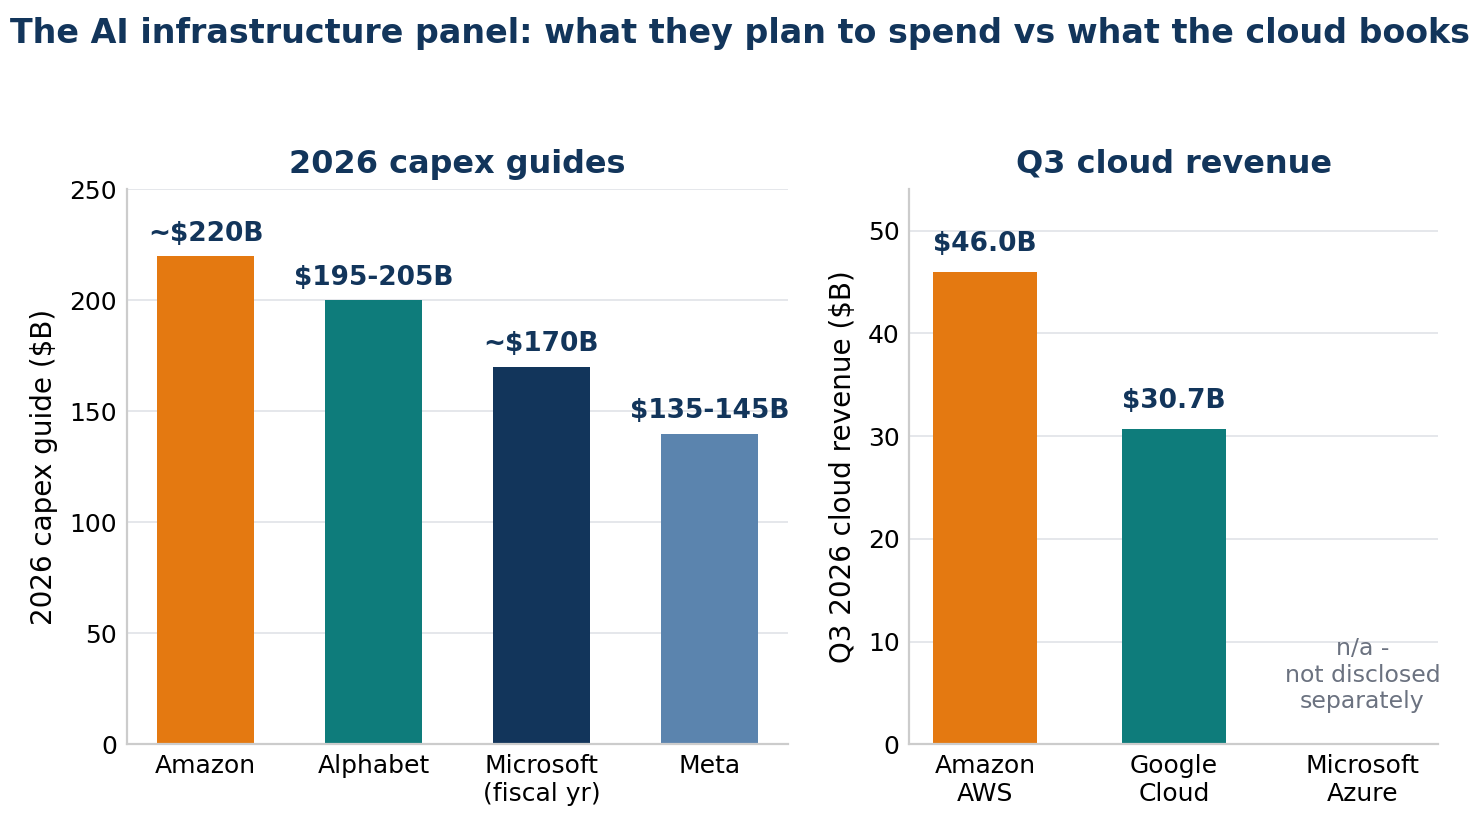
Every hyperscaler grew its cloud business faster than the Street expected - Azure +48%, AWS +39% (its fastest in nearly five years, to a $184B annualized run rate), and Google Cloud more than doubling to $30.71B. None of that spared the stocks. Alphabet's $51.36B of Q3 capex pushed quarterly free cash flow to -$9.07B and the stock fell 12.9% in the October 29 session; its EPS decline traced to an $8.2B equity-investment loss even as operating income rose 32%. Amazon's operating income of $28.08B smashed the ~$26.1B consensus and its operating margin hit a record 13.9%, yet with quarterly capex of roughly $76-77B and trailing free cash flow at -$42.4B, plus Q4 guidance midpoints a touch below consensus, the stock fell 7-11% after hours. Microsoft escaped the pattern only because its $45.2B capex-and-leases tab landed below the ~$50.7B feared and its Q2 Azure guide of 49-50% growth cleared a ~44.6% bar. Meta is the bridge case: a clean operating beat (+3.5-4% after hours) funded by an innovative new non-voting Class C share class - an effective 2-for-1 split effective January 19, 2027 - that creates fresh equity currency for AI spending, even as it raised its FY expense guide to $175-179B and posted -$2.12B of quarterly free cash flow. The market's message: AI revenue is real, but from here it must outrun its own cost curve in public.
2. Beats sold, guidance cuts crushed: the reaction function turned ruthless
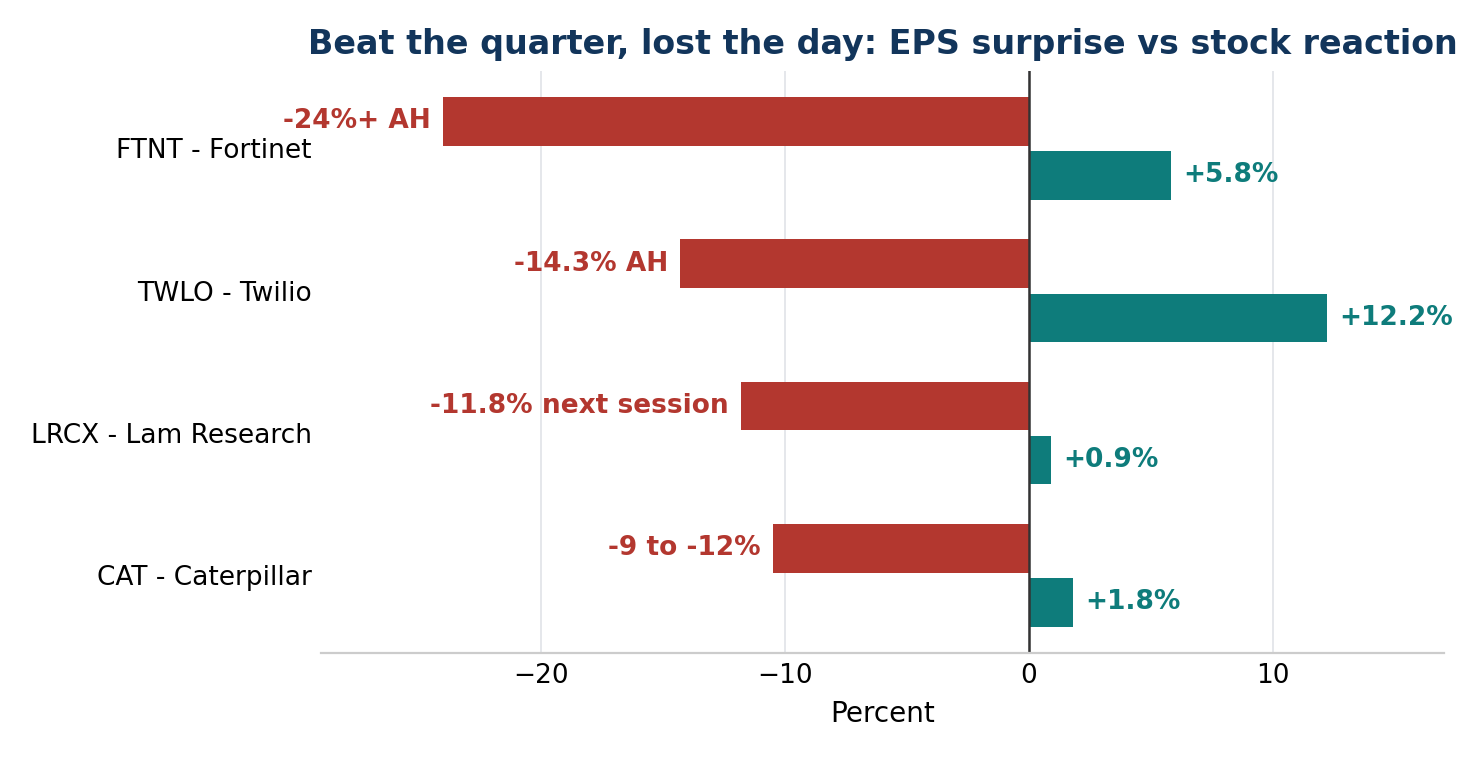
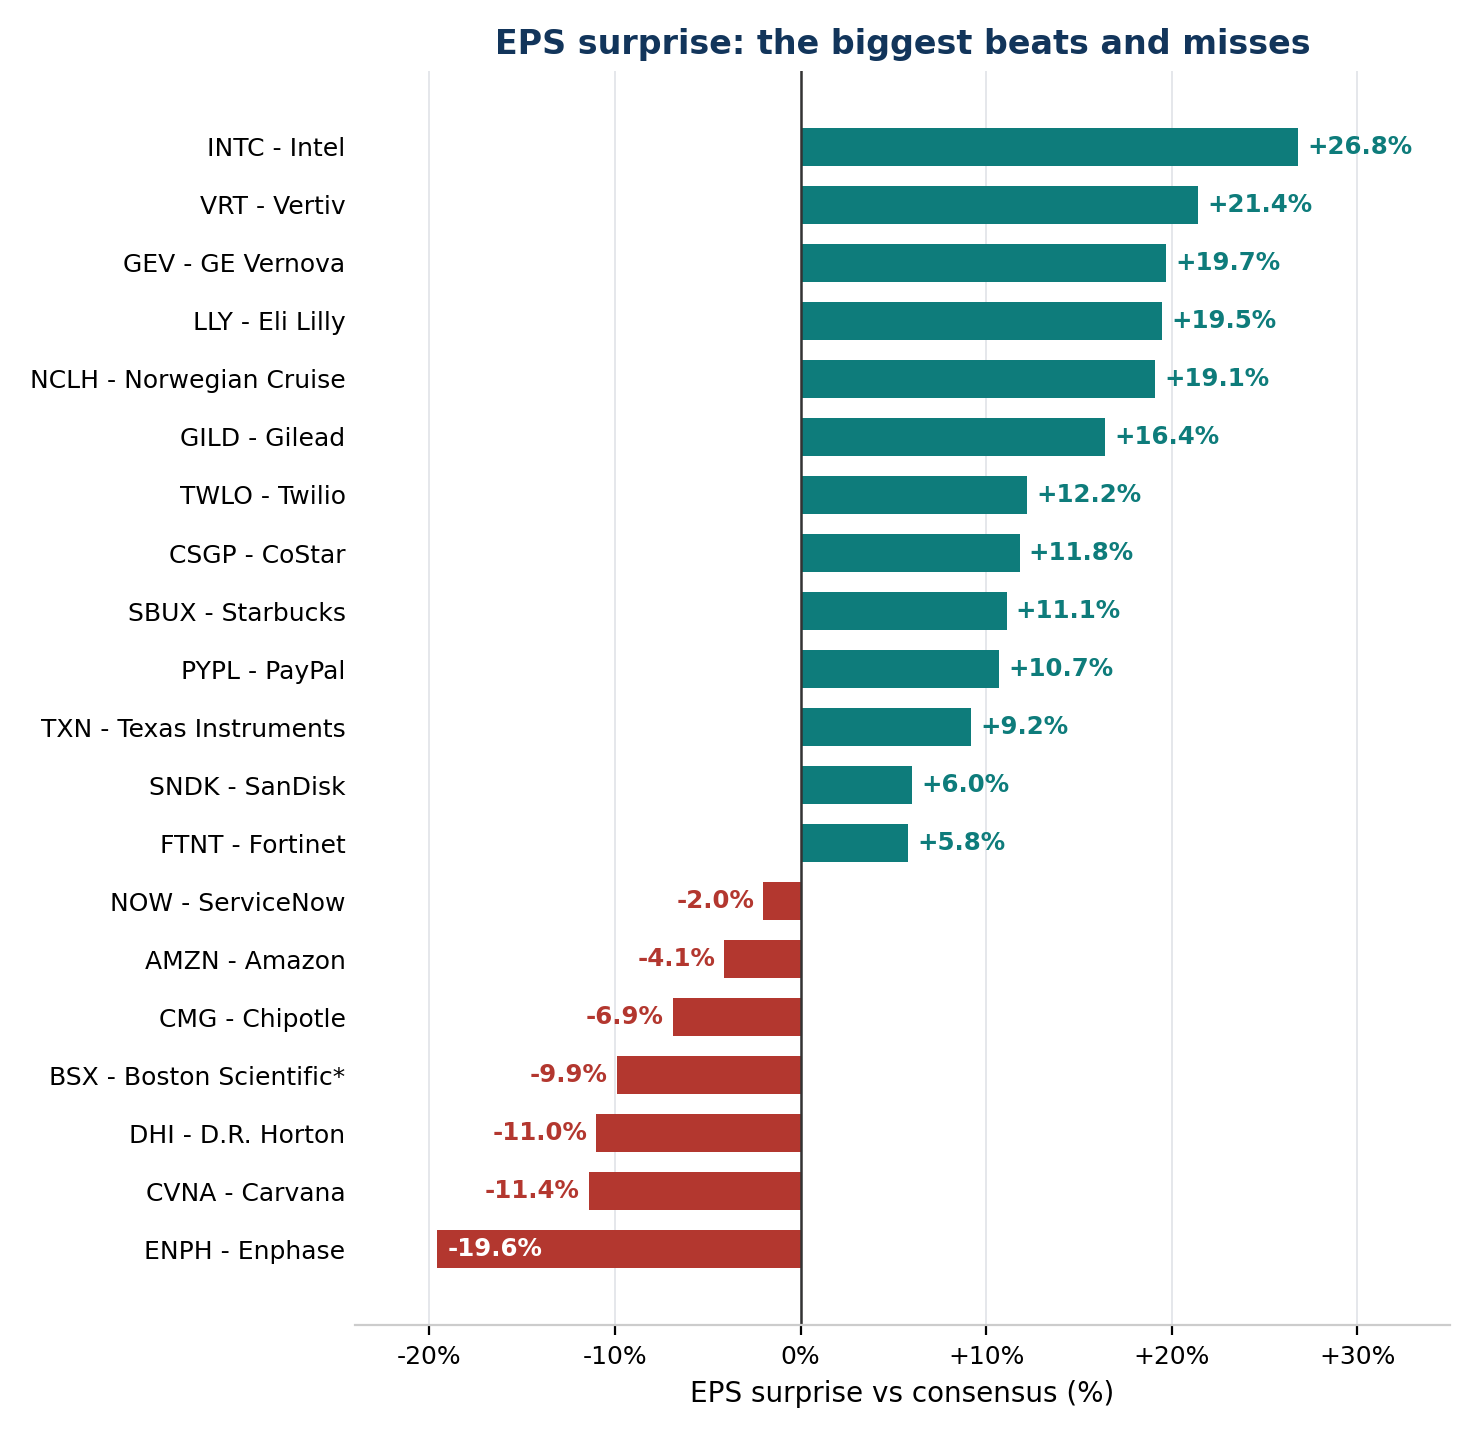
The season's defining trade was selling good news. Fortinet beat and raised - EPS $0.91 vs. $0.86, revenue +20.5%, billings +29% - and still fell more than 24% after hours after a +132% year-to-date run. Teradyne beat and fell ~6% after hours; Caterpillar beat (EPS $7.20, record $78.1B backlog) and dropped 9-12% because full-year guidance was merely maintained and Q4 growth was framed as 'moderate'; Lam Research edged past estimates and lost 11.8% the next session on an in-line guide. Against that backdrop, actual guidance cuts were treated as thesis-breaking: ServiceNow -26.8% in one session (worst in 14+ years) after guiding Q4 subscription-revenue growth to 18.5% vs. a 19.8% Street; Intel's Q4 guide ($15-16B revenue, $0.25 adjusted EPS vs. ~$17.2B / ~$0.44 expected) erased 17-21% after hours; Boston Scientific cut its year on an August cyberattack (-5.8%); Xylem cut and fell 14%+; Stryker cut and fell 7.6% after hours; D.R. Horton's fiscal 2027 guide landed well below consensus. With multiples full and a hawkish-leaning Fed, 'good but not more' was not good enough.
3. The memory supercycle: pricing power without precedent
If AI capex was the cost story, memory was the margin story. SK Hynix printed revenue of KRW 104.62 trillion (+328% year over year) and operating profit of KRW 83.33 trillion - an operating margin near 80% - with HBM4 in mass production, capacity effectively sold out through 2029, and KRW 100 trillion of 2026 shareholder returns (dividends plus buybacks). Samsung's chip division earned KRW 106.5 trillion of a record KRW 107.4 trillion group operating profit. In the U.S., SanDisk posted $11.0B of revenue (+378%), an 85.1% adjusted gross margin, data-center revenue up 1,682% year over year, and announced an 8-for-1 stock split - yet even SanDisk chopped around after hours and closed its print day -5.3%, the season's valuation discipline applied to its biggest winner. The through-line for the AI trade: the suppliers of scarce inputs are capturing the economics that the hyperscalers' cash-flow statements are currently surrendering.
4. Healthcare splits in two: GLP-1 momentum vs. medtech resets
Eli Lilly was the season's large-cap healthcare standout: revenue $24.4B (+39%) vs. $22.6B expected, adjusted EPS $7.48 vs. $6.26, Mounjaro at $10.72B and Zepbound at $5.35B, and a full-year revenue guide raised to $91-92B (the EPS guide was trimmed only for $4.57/share of acquired IPR&D charges); the stock rose 7.3%. Gilead beat and raised product-sales guidance on +18% HIV growth; Bristol Myers was mixed (revenue guide up, EPS guide cut on a charge). The device side went the other way: Boston Scientific missed the quarter it had guided ($0.73 vs. $0.80-0.82) and cut the year after an August cyberattack knocked out systems, losing 5.8% on the day and triggering a multi-firm downgrade wave; Stryker missed narrowly (EPS $3.52 vs. $3.55; revenue $6.52B vs. $6.62B) and cut FY EPS guidance to $14.80-14.90, falling 7.6% after hours. Same sector, opposite seasons: pharmaceutical pricing power and volume growth were rewarded, procedural-device guidance was not.
5. The consumer held - margins are the fight now
Consumer prints leaned resilient on demand and pressured on profit. Chipotle's comparable sales rose 2.1% (vs. 1.4% expected) but restaurant margins compressed (operating margin 13.7% vs. 15.9%), Q4 comps were guided to ~2% as October traffic softened - and the stock still rose 9.1% on October 29 as investors looked through to 2027. Starbucks beat on EPS ($0.80 vs. $0.72) with U.S. comps of +7.7%, set FY27 EPS guidance of $3.15-3.25, and traded flat: ticket, not traffic, is doing the work. Coca-Cola executed the classic beat-and-raise (EPS $0.91 vs. $0.88; FY guide lifted). Carvana grew revenue 42% to $8.04B with record 10.0% EBITDA margin but missed EPS. At the extremes: Whirlpool's deep miss (adjusted EPS -$0.21 vs. +$0.73 expected; FY guide slashed to -$1.30) marked the housing-adjacent consumer as the season's weakest link, while Norwegian Cruise Line's beat-and-raise (+13.45%) showed discretionary travel demand intact at the premium end.
Sector Deep Dives: The Prints That Mattered Most
Each deep dive covers the print, the guidance, and - critically this season - what the market did with it, and why.
Mega-Cap Technology & Internet
Microsoft (MSFT) - The Only Hyperscaler the Market Believed
Reported Wed Oct 28 (fiscal Q1) - Reaction: +5% after hours, ~+4.3% late
| EPS: actual vs est. | Revenue: actual vs est. | Guidance | Post-ER reaction |
|---|
| Adj $4.89 vs $4.73 est | $92.3B vs ~$90.7B est | Raised | +5% AH |
Microsoft delivered the cleanest megacap print of the season: revenue of $92.28B (+19%) vs. ~$90.7B expected and adjusted EPS of $4.89 vs. $4.73, with Azure growth of +48% - an acceleration the market had stopped expecting from a business of this scale. The decisive number, though, was the bill: capital expenditures plus finance leases of $45.2B came in well below the ~$50.7B consensus had penciled in, making Microsoft the one hyperscaler whose AI spending looked proportionate to its AI revenue in the quarter.
Guidance extended the benefit of the doubt. On the call, management guided fiscal Q2 Azure growth to 49-50% (vs. ~44.6% expected), flagged Q2 capex above $50B and a fiscal-year capex bill of roughly $170B - enormous, but framed as demand-led rather than speculative. With a $25B+ U.S. investment-grade bond sale (its first since 2017) launched the next day to help fund the buildout, Microsoft's message - spend big, but from strength - was exactly what a skeptical tape wanted to hear. The stock's +5% after-hours gain, against double-digit losses for Alphabet the same week, marks the season's clearest verdict on how the market now prices AI capex discipline.
Alphabet (GOOGL) - A Great Quarter, Priced as a Cash-Flow Problem
Reported Wed Oct 28 (Q3) - Reaction: -10 to -11% after hours; -12.9% in the Oct 29 session
| EPS: actual vs est. | Revenue: actual vs est. | Guidance | Post-ER reaction |
|---|
| Beat (op. income +32%) | $127.6B (+25%) | Maintained | -12.9% session |
By any operating measure, Alphabet's Q3 was superb: revenue of $127.6B grew +25%, operating income rose 32%, and Google Cloud more than doubled to $30.71B - the fastest cloud growth of any hyperscaler this season. Search revenue of $63.35B did narrowly miss a $64.96B estimate, and reported EPS fell, but the EPS decline traced to an $8.2B equity-investment loss, not operations.
The stock's punishment was about cash. Q3 capex of $51.36B drove free cash flow to -$9.07B, and investors fixated on the trajectory: Street expectations for 2027 capex above $300B circulate well above the company's own maintained 2026 guide of $195-205B. In a season where the Fed held with a tightening bias and the 10-year sat near 5%, a negative-FCF quarter from one of the market's largest cash generators was treated as a regime signal, not a one-off. Eighteen of 21 analysts cut targets in the following wave (Piper Sandler $400 to $345; Morgan Stanley $400 to $375; Citizens JMP downgraded to Market Perform), even as most kept buy ratings - the signature pattern of a de-rating, not a thesis break.
Meta Platforms (META) - Funding the Buildout With a New Share Class
Reported Wed Oct 21 (Q3) - Reaction: +3.5-4% after hours
| EPS: actual vs est. | Revenue: actual vs est. | Guidance | Post-ER reaction |
|---|
| Adj $7.40 (GAAP $3.83*) | $64.6B vs $63.3B est | Mixed | +3.5-4% AH |
Meta's Q3 beat on the lines that matter: revenue of $64.6B (+26%) vs. $63.3B expected and adjusted EPS of $7.40. Reported GAAP EPS of $3.83 absorbed a $9.9B teen-mental-health settlement charge (which also drove operating income of ~$13B well below the ~$20.9B consensus), and the company raised its full-year expense guide to $175-179B while narrowing 2026 capex to $135-145B. Q4 revenue guidance of $73-76B bracketed consensus. Quarterly free cash flow was -$2.12B - negative, but the market had been braced for worse after the stock's pre-print slide.
The strategic headline was financial engineering in service of AI: the board approved a new non-voting Class C share class - an effective 2-for-1 split, effective January 19, 2027 - creating a fresh equity currency to fund AI investment without diluting voting control. Combined with the upsized ~$97.5B multi-part offering Meta raised during the season (roughly 5x covered), Meta showed the market a funding plan rather than an open-ended bill. Shares rose 3.5-4% after hours. The offsetting legal overhang is real - a New Mexico judge separately ordered $25B in the Cambridge Analytica case the same week (Meta will appeal) - but for this print, investors rewarded the operator that paired AI ambition with visible financing.
Amazon (AMZN) - Record Margins, a Guidance Discount, and a Capex Bill
Reported Thu Oct 29 (Q3) - Reaction: -7 to -11% after hours (from a $244.39 close, -4.0% on the day)
| EPS: actual vs est. | Revenue: actual vs est. | Guidance | Post-ER reaction |
|---|
| $1.89 vs ~$1.97 est | $201.9B vs ~$202.3B est | Below cons. | -7 to -11% AH |
Amazon's Q3 was a study in offsetting extremes. EPS of $1.89 missed the ~$1.97 consensus and net sales of $201.9B (+12%) came in a shade below ~$202.3B expected - though inside the company's own $197-202B guide, and flattered by nothing: Prime Day's move to June cost roughly 400bp of growth. Against that, operating income of $28.08B crushed the ~$26.1B consensus, operating margin hit a record 13.9%, and AWS was the quarter's star: $45.98B of revenue, +39% year over year - its fastest growth in nearly five years - to a $184B annualized run rate, with management projecting AWS growth above 40% in both 2027 and 2028.
Segment detail was solid underneath: North America sales of ~$112.9B with operating income nearly doubling to $8.7B, International at $43.1B / $1.6B, AWS operating income of $17.8B. What the market sold was the forward math: Q4 guidance of $240-247B in sales and $28.5-33.5B in operating income put both midpoints below consensus (~$245B / ~$33B), and Q3 capex of roughly $76-77B has swung trailing-twelve-month free cash flow to -$42.4B against a maintained ~$220B full-year capex plan. Amazon has the season's best retail-margin story and its fastest cloud growth in years; it also has the season's largest cash-consumption story. On October 29, the second story won.
Tesla (TSLA) - EPS Beat, Revenue In Line, Capex Cut
Reported Wed Oct 21 (Q3) - Reaction: faded from +1-2% to -3.3% after hours
| EPS: actual vs est. | Revenue: actual vs est. | Guidance | Post-ER reaction |
|---|
| Adj $0.48 vs $0.45 est | $28.05B vs ~$28.06B est | Cut (capex) | -3.3% AH |
Tesla's Q3 landed almost exactly on the numbers: revenue of $28.05B vs. ~$28.06B expected, adjusted EPS of $0.48 vs. $0.45 expected, gross margin of 19.6%, and free cash flow of +$1.53B - a big beat on cash. GAAP net income of $787M fell 43% year over year. Deliveries were 486,532; FSD attach exceeded 75% of North American deliveries with 1.74M active subscriptions (+67% year over year); cash stood at $45.4B. The notable guide change was a full-year capex cut to $20B from $25B - discipline the market would applaud anywhere else.
The stock's fade from an initial +1-2% pop to -3.3% after hours captured Tesla's peculiar position this season: the print was fine, but the equity story now trades on corporate optionality (the Tesla-SpaceX merger special-committee process Musk confirmed around SpaceX's print, and a nine-firm price-target raise wave the following Monday that took the stock +5.2%) more than on quarterly auto fundamentals. Musk's call commentary - Optimus shipments to outside companies targeted by end of next year, industrial uses first - kept the optionality bid alive even as the core numbers merely matched.
Netflix (NFLX) - The Ad Business Gets a 'Show-Me' Price
Reported Tue Oct 20 (Q3) - Reaction: -5 to -6% after hours
| EPS: actual vs est. | Revenue: actual vs est. | Guidance | Post-ER reaction |
|---|
| Beat | Beat; Q4 guide $13.44B | Cut (ads) | -5 to -6% AH |
Netflix beat its Q3 numbers but cut the outlook the market cared about: Q4 revenue guidance of $13.44B came with a reduced full-year advertising forecast of ~$2.7B (Oct 20 print), reframing the ad tier from growth engine to work-in-progress. Shares fell 5-6% after hours and the analyst community spent the following week marking the stock to the new reality: Bernstein cut its target $95 to $80, Goldman Sachs $90 to $84, BofA $105 to $90, and Needham downgraded to Hold, among a broad wave of cuts.
The NFLX print is the season's cleanest example of a guidance-driven de-rating in consumer tech: no demand collapse, no margin shock - simply a slower monetization ramp for the newest revenue line, repriced immediately at a premium multiple. With the stock printing new lows back to August 2024 during the season, the burden of proof has shifted to delivery on the ad build-out.
SpaceX (SPCX) - First Profit, Enormous Capex, Merger Committees
Reported Tue Oct 20 (Q3) - Reaction: +10.5% premarket (Oct 21)
| EPS: actual vs est. | Revenue: actual vs est. | Guidance | Post-ER reaction |
|---|
| Net income $4.4B (1st profit) | $14.58B vs ~$12.7B est | - | +10.5% pre-mkt |
SpaceX's Q3 was a landmark for the newly public company: revenue of $14.58B (+161% year over year) vs. ~$12.7B expected and net income of $4.4B - its first profitable quarter. The composition surprised: the AI (Super Intelligence) segment contributed $7.56B, surpassing Starlink, and AI capex of $16.4B in the quarter with a Q4 capex guide of $35-40B (roughly double expectations) lit up the entire AI supply chain in sympathy the following session.
Layered on top was corporate drama with real market consequences: Musk confirmed Tesla and SpaceX have formed special committees to evaluate a merger, floated $1T of revenue by 2028 as 'no longer impossible,' and analysts raced to reprice the combined optionality (Citi Buy $240; Cantor Fitzgerald $345). The counterweights are leverage and float: a ~$40B debt raise during the season (Pimco took $4B of it) and lockup tranches (1.3B shares Oct 22, 328M Oct 24, final expiry Dec 8) that keep supply overhanging the story. SpaceX was the season's most consequential single print for the broader AI complex.
Semiconductors & Hardware
The Memory Complex at a Glance
| Company | Revenue | Profit | Margin / mix | Reaction |
|---|
| SK Hynix | KRW 104.62T (+328%) | Op. profit KRW 83.33T (+632%) | Op. margin ~80% | +10.9% session |
| Samsung Electronics | KRW 195.25T (+127%) | Op. profit KRW 107.4T (~9x y/y) | Chips = ~99% of group op. profit | -4%+ session |
| SNDK - SanDisk | $11.03B (+378%) | Non-GAAP EPS $49.51 | Adj. gross margin 85.1% | +2% AH; -5.3% print day |
Intel (INTC) - A Beat, Then a Guidance Reset With a Body Count
Reported Thu Oct 29 (Q3) - Reaction: -17 to -21% after hours (prints ~$73-77, from a $92.07 close)
| EPS: actual vs est. | Revenue: actual vs est. | Guidance | Post-ER reaction |
|---|
| Adj $0.52 vs $0.41 est | $16.5B vs $16.6B est | Cut (Q4) | -17 to -21% AH |
Intel's reported quarter was genuinely good. Revenue of $16.5B (+21%) was essentially in line with the $16.56B FactSet consensus and above the company's own guide; adjusted EPS of $0.52 beat the $0.41 consensus (GAAP EPS $0.60); and Data Center & AI revenue of $7.3B surged +78% - ahead of the ~$6.7B forecast and, per CFO Dave Zinsner, the strongest data-center growth in 15 years. Client computing fell 5% to $8.1B, Foundry grew 58% to $6.7B, and operating cash flow was $5.1B.
Then came the guide. Q4 revenue of $15-16B (vs. ~$17.1-17.3B consensus), adjusted EPS of $0.25 (vs. ~$0.43-0.45), and non-GAAP gross margin of 38.0% (vs. ~42.8%) amount to a full reset. The proximate cause is operational, not demand: the October explosion at the Kiryat Gat fab in Israel took the plant offline for about two weeks - Zinsner quantified roughly $300M of Q4 revenue and ~200bp of gross margin, with a similar revenue impact expected in Q1 - and management separately expects the PC market to decline at least through H1 2027. After a ~150% year-to-date run, the stock had no cushion for a two-quarter hole: it lost roughly a fifth of its value after hours. The season's harshest reminder that at full multiples, guidance is the earnings report.
SanDisk (SNDK) - 85% Gross Margins and a Stock Split
Reported Thu Oct 29 (fiscal Q1 2027) - Reaction: +2% after hours, choppy; closed print day -5.3%
| EPS: actual vs est. | Revenue: actual vs est. | Guidance | Post-ER reaction |
|---|
| Non-GAAP $49.51 vs ~$46.7 est | $11.0B vs ~$10.7B est | Raised | +2% AH (choppy) |
SanDisk's September quarter reads like a misprint from a different industry: revenue of $11.03B (+378% year over year) vs. ~$10.7B expected, non-GAAP EPS of $49.51 (GAAP $52.60) vs. ~$46.7B-scale expectations, an 85.1% adjusted gross margin, data-center revenue up 1,682% to $4.8B, $5.0B of buybacks in the quarter, and December-quarter guidance of $12.2-12.6B revenue with adjusted EPS of $55-57 - above consensus. The board also approved an 8-for-1 forward stock split (record Nov 9; distribution Nov 19; split-adjusted trading Nov 20) after a run of more than +450% in 2026.
The market's response - a choppy after-hours session around +2% after a -5.3% regular session - is the season in miniature: flawless execution, priced for more. Edge revenue ($5.8B) actually missed a $6.07B forecast and consumer fell 39%, small cracks that matter at this multiple. SanDisk remains the purest public expression of NAND pricing power; October showed that even purity trades at a discount to perfection.
SK Hynix - An 80% Operating Margin, Sold Out Through 2029
Reported Wed Oct 28 (Q3, Korea) - Reaction: +10.9% on the day; KOSPI +6.63% to a record close above 6,000
| EPS: actual vs est. | Revenue: actual vs est. | Guidance | Post-ER reaction |
|---|
| Net ~KRW 40T vs ~55T est | KRW 104.6T (+328%) | - | +10.9% session |
SK Hynix's Q3 was the memory supercycle's defining print: revenue of KRW 104.62 trillion (+328% year over year) and operating profit of KRW 83.33 trillion (+632%) - an operating margin of roughly 80% - powered by HBM leadership, with HBM4 in mass production and capacity effectively sold out through 2029. Net profit of ~KRW 40 trillion missed a ~KRW 55 trillion estimate, a reminder that even this cycle has a cost line. Management paired the print with KRW 100 trillion of 2026 shareholder returns (at least KRW 30T of dividends plus KRW 60T+ of buybacks, including a new KRW 20T program with KRW 10T earmarked for cancellation).
For U.S. investors, SK Hynix is the read-across that matters most to the AI complex: the HBM supplier is capturing economics at a rate that reframes the hyperscaler capex debate - the spend is someone else's record margin. Its +10.9% session (Samsung +9.0%) drove the KOSPI's first close above 6,000 since October 14 and set up the U.S. memory complex's strong week.
Samsung Electronics - A Record Quarter With a Soft Underbelly
Reported Thu Oct 29 (Q3, Korea) - Reaction: -4%+ in the Oct 29 Seoul session; KOSPI -2.6%
| EPS: actual vs est. | Revenue: actual vs est. | Guidance | Post-ER reaction |
|---|
| Net KRW 75.2T vs ~84T est | KRW 195.3T (+127%) | - | -4%+ session |
Samsung's Q3 set records at the top: operating profit of KRW 107.4 trillion (~$80B), nearly ninefold year over year, on revenue of ~KRW 195.25 trillion (+127%), with the chip division contributing KRW 106.5 trillion of the profit. The caveats were equally clear: net profit of KRW 75.15 trillion missed a ~KRW 84 trillion estimate, the mobile business swung to a ~KRW 600B loss, and management guided to a deepening chip shortage next year (bullish for pricing, awkward for its own device margins). A KRW 30 trillion dividend rounded out the print.
The -4% share reaction - dragging the KOSPI down 2.6% on the day Alphabet's print hit U.S. futures - shows the conglomerate discount at work: Samsung's memory windfall is being valued through the drag of its consumer businesses, where SK Hynix's is not. For the global AI trade, the operational takeaway is corroborating: memory supply tightens into 2027, which supports the pricing power documented across this report.
Software, Fintech & Crypto
ServiceNow (NOW) - The Season's Most Expensive Two Percentage Points
Reported Wed Oct 28 (Q3) - Reaction: -14 to -17% after hours; -26.8% in the Oct 29 session (worst day in 14+ years)
| EPS: actual vs est. | Revenue: actual vs est. | Guidance | Post-ER reaction |
|---|
| Adj $1.00 vs $1.02 est | $4.11B (+20.5%), beat | Cut (cRPO) | -26.8% session |
ServiceNow's Q3 was, on its face, a fine quarter: revenue of $4.11B grew +20.5% and beat consensus. The damage was in two places: adjusted EPS of $1.00 missed the $1.02 consensus, which management attributed to Armis acquisition costs, and - decisively - Q4 current remaining performance obligations (cRPO) growth was guided to 18.5% vs. a 19.8% Street expectation. For a premium-multiple software name whose valuation rests on durable ~20% subscription growth, a guide that starts with '18' was treated as regime change.
The aftermath was a genuine analyst split rather than a rout: Baird raised its target to $185 from $125 and Jefferies raised to $145, while Morgan Stanley ($180 to $160), TD Cowen ($165 to $160), Truist ($180 to $150), UBS and BTIG cut. The stock closed October 29 at $109.95, down 26.8% on the day. NOW's print also dragged the whole seat-based SaaS complex (Salesforce fell 5-6% after hours in sympathy with no company news of its own), reigniting the 'AI disrupts seat-based software' de-rating that has stalked the group all year.
Fortinet (FTNT) - Beat, Raise, and a 24% Lesson in Positioning
Reported Wed Oct 28 (Q3) - Reaction: -24%+ after hours
| EPS: actual vs est. | Revenue: actual vs est. | Guidance | Post-ER reaction |
|---|
| $0.91 vs $0.86 est | $2.08B (+20.5%) | Raised | -24%+ AH |
Fortinet did everything asked of it: EPS of $0.91 vs. $0.86 expected, revenue of $2.08B up +20.5%, billings growth of +29%, and a raised outlook. The stock fell more than 24% after hours anyway. The explanation is positioning, not performance: after a +132% year-to-date run into the print, the marginal buyer needed acceleration, and a beat-and-raise at an unchanged slope read as deceleration at the multiple.
FTNT is this season's purest case study in expectations arbitrage, and it rhymes with Teradyne (-6%+ after hours on a beat), Caterpillar (-9 to -12% on a beat), and Lam Research (-11.8% the day after a narrow beat). In each case the fundamentals improved and the stock fell, because the entry price had already capitalized the improvement. For investors, the practical lesson of October is that 'beat and raise' has split into two trades: beat-and-raise-and-accelerate (Vertiv, Celestica: rewarded) and beat-and-raise-and-repeat (punished).
SoFi (SOFI) - The Fintech Beat-and-Raise That Worked
Reported Tue Oct 27 (Q3) - Reaction: +13.4% close ($16.40); +2.7% more on Oct 28
| EPS: actual vs est. | Revenue: actual vs est. | Guidance | Post-ER reaction |
|---|
| $0.18, beat | $1.39B (+44%) | Raised | +13.4% session |
SoFi delivered the consumer-finance print of the season: EPS of $0.18, revenue of $1.39B (+44%), a raised FY26 outlook (revenue ~$5.04B, EPS ~$0.61) and an initial 2027 guide (~$6.4B revenue, ~$0.90 EPS) that framed growth as durable rather than cyclical. The stock closed +13.4% and kept climbing the next day as the analyst wave landed: Citi (Buy, $30), Needham (Buy, $24), StoneX ($25 to $27), Scotiabank ($25 to $26), Monness ($20 to $22) against skeptics at TD Cowen ($18), Wells Fargo ($18) and KBW (Underperform, $16).
SoFi's reception matters beyond the name: it shows the market will still pay up, immediately and in size, for a guidance raise that extends the growth runway - the same tape that was simultaneously selling Fortinet's raise. The difference was slope: SoFi guided the out-year up, not just the quarter. With its tokenized-deposit product (SOFIE, 4.40% APY) launched days earlier, SoFi exits October as the season's fintech momentum leader.
Coinbase (COIN) - A Profit Made of Mark-to-Market
Reported Thu Oct 29 (Q3) - Reaction: ~-2% after hours
| EPS: actual vs est. | Revenue: actual vs est. | Guidance | Post-ER reaction |
|---|
| Net inc. $719M (incl. $715M gain) | $1.22B (-35%) | - | ~-2% AH |
Coinbase's Q3 headline - net income of $719M - dissolves on inspection: $715M of it was a gain on crypto held for investment. The operating business shrank with the market: revenue of $1.22B fell 35% year over year, transaction revenue dropped 44% to $590M, adjusted net income was $78M, and adjusted EBITDA of $332.9M, while better than feared, was down 58% year over year. The mix shift is real - subscription and services revenue of $570M is now roughly half the business, USDC balances are at records, and prediction markets annualize above $200M - but it is not yet a hedge against a quiet crypto tape.
Q4 subscription/services guidance of $550-630M and a trimmed full-year expense outlook ($4.15-4.30B) kept the after-hours damage to ~-2% - modest by this season's standards, and a sign that expectations had already reset after a weak Q2. Read alongside Strategy's (MSTR) $19.5B of Q3 net income on a $20.91B digital-asset gain (with core software revenue of $125.4M, -3%), October's crypto prints underline how much of the sector's reported 'profit' is now a function of bitcoin's price rather than operating performance - a fact the market increasingly prices in advance.
Healthcare
Healthcare's Split Season at a Glance
| Company | Verdict | Guide direction | Reaction |
|---|
| LLY - Eli Lilly | Beat: EPS $7.48 vs $6.26 est | Mixed: revenue raised; EPS trimmed on IPR&D charges | +7.3% session |
| BMY - Bristol Myers | Mixed: revenue beat; Opdivo missed | Mixed: revenue raised; EPS cut on a charge | - |
| GILD - Gilead | Beat: EPS $2.55 vs $2.19 est | Mixed: product-sales guide raised; loss guide widened | - |
| BSX - Boston Scientific | Miss: EPS $0.73 vs $0.80-0.82 guide | Cut (FY, after Aug cyberattack) | -5.8% session |
| SYK - Stryker | Narrow miss: EPS $3.52 vs $3.55 est | Cut (FY) | -7.6% AH |
| XYL - Xylem | Miss on both lines | Cut (FY) | -14%+ session |
Eli Lilly (LLY) - The GLP-1 Juggernaut Raises the Bar Again
Reported Thu Oct 29 (Q3) - Reaction: +7.3% on the day
| EPS: actual vs est. | Revenue: actual vs est. | Guidance | Post-ER reaction |
|---|
| Adj $7.48 vs $6.26 est | $24.4B vs $22.6B est | Mixed | +7.3% session |
Lilly produced the season's biggest clean large-cap beat: revenue of $24.4B (+39%) vs. $22.61B expected and adjusted EPS of $7.48 vs. $6.26 (LSEG), powered by Mounjaro ($10.72B) and Zepbound ($5.35B). The full-year revenue guide was raised to $91-92B from $85-87B; the adjusted EPS guide was trimmed to $35-36 from $35.50-36.50, but the cut is arithmetic, not commercial - $4.57 per share of acquired IPR&D charges sits inside it.
The +7.3% session made Lilly the day's standout in a tape dominated by the Alphabet and ServiceNow selloffs, and the contrast is the point: Lilly is the rare megacap whose guidance revisions still point up on the line that matters (revenue), with a visible multi-year volume runway behind it. In a season defined by the market's refusal to pay for promises, Lilly's print was all delivery.
Boston Scientific (BSX) - A Cyberattack Meets a Full Multiple
Reported Wed Oct 28 (Q3) - Reaction: -5.8% close ($42.43); new 52-week low intraday
| EPS: actual vs est. | Revenue: actual vs est. | Guidance | Post-ER reaction |
|---|
| Adj $0.73 vs $0.80-0.82 guide | Miss (cyberattack) | Cut (FY) | -5.8% session |
Boston Scientific's quarter carried an asterisk that overwhelmed the business: an August cyberattack that disrupted operations left adjusted EPS at $0.73, below the company's own $0.80-0.82 guidance, and management cut full-year EPS guidance to $3.16-3.18 from $3.28-3.32. The stock fell 5.8% on the day to $42.43 after printing a new 52-week low at $39.57 intraday.
The analyst response turned a one-off into a de-rating: JPMorgan downgraded to Neutral ($46 target), Jefferies cut Buy to Hold ($60 to $46), Oppenheimer moved to Perform, and Needham and BTIG trimmed targets ($57 to $48; $56 to $49), with a broader cut wave behind them (RBC $70 to $52; UBS $67 to $57; Citi $48 to $44, among others). BSX, with Stryker's guide cut a day later, defined medtech's October: operational accidents at premium multiples get no forgiveness quarter. Whether the cyberattack's effects are truly one-quarter events is now the central question for the group into year-end.
Industrials, Defense & Power Infrastructure
Caterpillar (CAT) - Record Backlog, 'Moderate' Framing, Double-Digit Fall
Reported Thu Oct 29 (Q3) - Reaction: -9 to -12% (premarket to session)
| EPS: actual vs est. | Revenue: actual vs est. | Guidance | Post-ER reaction |
|---|
| Adj $7.20 vs ~$7.07 est | $20.7B (+17%) | Maintained | -9 to -12% |
Caterpillar's Q3 beat: adjusted EPS of $7.20 vs. ~$7.06-7.08 expected, revenue of $20.7B (+17%), and a record $78.1B backlog that speaks to genuine end-demand across construction and energy & transportation. What the stock could not survive was the framing: full-year guidance was only maintained, and Q4 sales growth was characterized as 'moderate.' Shares fell 9-10% premarket and around 12% intraday.
CAT's treatment is the industrial echo of the Fortinet pattern - at a full multiple after a long run, 'maintained' is a downgrade. It also throws the sector's split into relief: the same week, the data-center-exposed industrials (GE Vernova, Vertiv, Flex) were raising guides and being rewarded, while the classic cyclicals were marked down on caution. The backlog says the cycle is intact; the tape says investors want the orders converted into raised numbers, not adjectives.
Boeing (BA) - The MAX Timeline Slips Again
Reported Tue Oct 27 (Q3) - Reaction: -10.7% on the day, to $168.18
| EPS: actual vs est. | Revenue: actual vs est. | Guidance | Post-ER reaction |
|---|
| - | - | Cut (MAX timeline) | -10.7% session |
Boeing's Q3 was the season's industrial disappointment: the stock plunged 10.7% to $168.18 as the 737 MAX 10 certification/production ramp was pushed toward H2 2027, overwhelming a free-cash-flow beat ($464M) and a $745B backlog. When a recovery story's central milestone moves right by quarters, the quarter's other numbers stop mattering.
The analyst response was a uniform target-cut wave with ratings largely intact - JPMorgan $290 to $240 (Overweight kept), BofA $270 to $235, UBS $275 to $240, Jefferies $265 to $230, Barclays $300 to $250, TD Cowen $240 to $210, Baird $300 to $230, Susquehanna $285 to $250, Morgan Stanley $225 to $195 and BNP Paribas Exane $265 to $205 - a map of a story being pushed out in time rather than abandoned. Boeing exits October as the market's reminder that execution timelines, like guidance, are now priced with zero benefit of the doubt.
GE Vernova (GEV) - Orders +96%, Buyback Doubled
Reported Wed Oct 28 (Q3) - Reaction: beat-and-raise; sector leadership on the day
| EPS: actual vs est. | Revenue: actual vs est. | Guidance | Post-ER reaction |
|---|
| $4.81 vs ~$4.02 est | $12.64B vs ~$12B est | Raised | Beat-and-raise |
GE Vernova printed the power complex's definitive quarter: EPS of $4.81 vs. ~$4.01-4.03 expected, revenue of $12.64B (+27%), orders of $29B (+96% organically), and a $197B backlog expected to cross $200B in Q4, with gas slot reservations of 116-122 GW heading for 130 GW+ by year-end. Full-year guidance was raised to ~$47B of sales and ~$6.6B of EBITDA, the buyback authorization was doubled from $10B to $20B, and the company announced the $9B acquisition of Trench Group (high-voltage grid equipment) from Triton, expected to close in late 2027.
GEV is the industrial mirror of the memory trade: it sells scarce capacity into the AI buildout (turbines, grid gear) and is converting that scarcity into orders, price, and now M&A. Unlike the hyperscalers it supplies, its capex story is its customers' problem - which is precisely why the market pays for it.
Vertiv (VRT) - The Blowout of the Season
Reported Wed Oct 28 (Q3) - Reaction: +14-17% premarket
| EPS: actual vs est. | Revenue: actual vs est. | Guidance | Post-ER reaction |
|---|
| Adj $2.21 vs $1.82 est | $4.31B vs $3.75B est | Raised | +14-17% pre-mkt |
Vertiv's Q3 was the season's most decisive beat-and-raise: adjusted EPS of $2.21 vs. $1.82 consensus, revenue of $4.31B (+61% year over year) vs. $3.75B expected, and organic orders up more than 100% year over year. Full-year guidance was raised to net sales of $14.45-14.85B and adjusted EPS of $7.10-7.20 vs. a ~$6.73 consensus midpoint. The stock jumped 14-17% premarket.
Vertiv, with Celestica (+15-17% after hours on its own blowout and $40B 2027 outlook) and Flex (+9.4% on a fiscal Q2 beat-and-raise), formed the season's winning industrial cluster: the arms dealers of the data-center buildout whose order books are accelerating faster than their customers' cash-flow anxiety. The group's prints are the strongest fundamental evidence in this report that AI infrastructure demand is still inflecting up - whatever the hyperscalers' stocks did with the news.
Consumer & Housing
Chipotle (CMG) - Comps Beat, Margins Squeezed, Stock Shrugs
Reported Wed Oct 28 (Q3) - Reaction: +9.1% in the Oct 29 session
| EPS: actual vs est. | Revenue: actual vs est. | Guidance | Post-ER reaction |
|---|
| Adj $0.27 vs $0.29 est | $3.29B (+9.6%), in line | - | +9.1% session |
Chipotle's Q3 mixed the good with the pressured: adjusted EPS of $0.27 missed the $0.29 consensus and operating margin compressed to 13.7% from 15.9%, but revenue of $3.29B (+9.6%) was in line and comparable sales of +2.1% beat the +1.4% expected. On the call, Q4 comps were guided to ~2% as October traffic softened, with Q4 restaurant margin expected just under 22%.
The stock rose 9.1% the next session - investors chose the traffic stabilization over the margin math - and the analyst response was a cluster of target trims with bullish ratings intact (Telsey $48 to $40; RBC $45 to $40; KeyBanc $42 to $40; Bernstein $50 to $43; BNP $39 to $36; Citi $43 to $41; JPMorgan $37 to $36; Mizuho $37 to $35). CMG's October is the consumer story in one stock: demand is fine, the P&L fight has moved to labor and input costs, and the market is willing to fund the transition - at a lower target price.
Starbucks (SBUX) - Ticket-Led Recovery, Carefully Guided
Reported Thu Oct 29 (fiscal Q4) - Reaction: roughly flat after hours
| EPS: actual vs est. | Revenue: actual vs est. | Guidance | Post-ER reaction |
|---|
| Adj $0.80 vs $0.72 est | $9.14B, slight miss | FY27 guide set | Flat AH |
Starbucks closed its fiscal year with an EPS-led beat: adjusted EPS of $0.80 vs. $0.72 expected, global comparable sales of +7.2% and U.S. comps of +7.7% - the latter driven more by average ticket (+5.2%) than by transactions - against revenue of $9.14B that narrowly missed. International comps of +0.9% lagged a 3.2% expectation. The company introduced FY27 guidance of $3.15-3.25 in non-GAAP EPS, with consolidated revenue expected to decline ~1% largely on the China joint-venture transition.
A flat after-hours reaction was, by this season's standards, a pass: the guide was credible, the U.S. turnaround metrics held, and nothing in the print forced a de-rating. Starbucks exits the season as the consumer sector's 'show-me' story - the recovery is real but ticket-led, and 2027 must convert pricing into traffic.
D.R. Horton (DHI) - Housing Remains the Weak Spot
Reported Thu Oct 29 (fiscal Q4) - Reaction: reported after the Oct 29 open; sector read-through negative
| EPS: actual vs est. | Revenue: actual vs est. | Guidance | Post-ER reaction |
|---|
| $2.67 vs ~$3.00 est | $9.37B vs ~$9.09B est | Cut (FY27) | Not final at publication |
The nation's largest homebuilder delivered the season's clearest housing warning: EPS of $2.67 missed the ~$3.00-3.01 consensus even as revenue of $9.37B beat ~$9.09-9.11B, orders fell 7%, and cancellations ran at 23%. The fiscal 2027 guide was the real print: revenue of $30-32B vs. a $33.7B consensus and 79,000-84,000 closings vs. ~86,200 expected - a builder planning for a smaller, more incentive-heavy year.
With the 10-year Treasury near 5% and the Fed holding with a hiking bias, DHI's guide quantifies what the rates complex implies: housing demand cannot clear at current mortgage rates without margin-diluting incentives. The read-through touches the whole housing chain (builders such as Lennar, suppliers, and housing-adjacent consumer names like Whirlpool, which slashed its own FY guide to -$1.30 this week). Of all the season's sector signals, housing's was the only unambiguous deterioration.